
Coral Bleaching Data Analysis Activity (Climate Change, NGSS HS Biology)
$4.75
Data Analysis Activity | 8th – 12th | Biology, Chemistry, Environment
Description
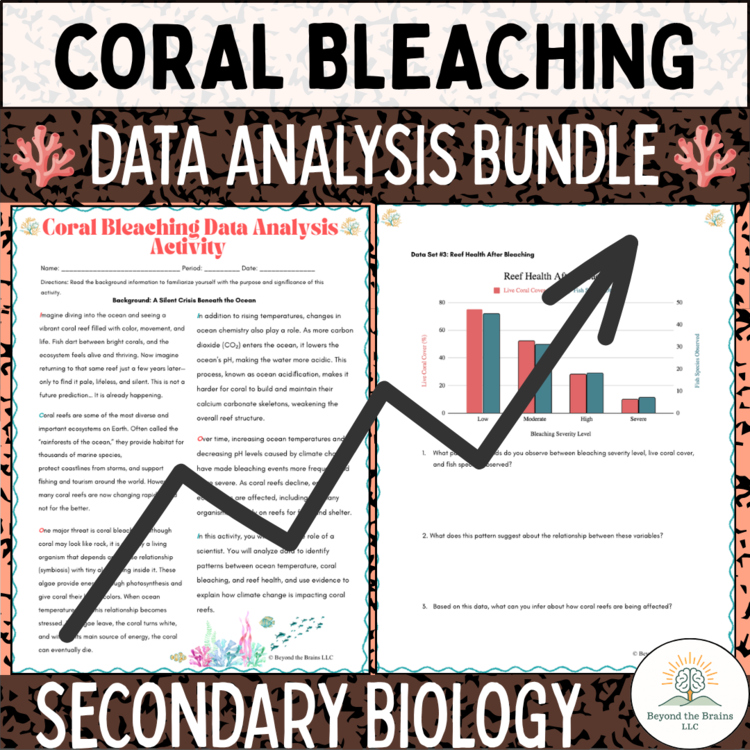
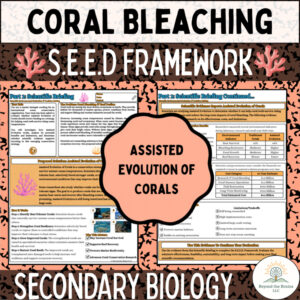
The link between warming water and bleaching reefs is a claim students hear often. This activity makes them prove it from data. Students graph and interpret sea-surface temperature anomalies and bleaching extent, and uncover the pattern in real coral bleaching data themselves — the temperature signal is in the numbers before it’s ever in the lecture.
What’s inside
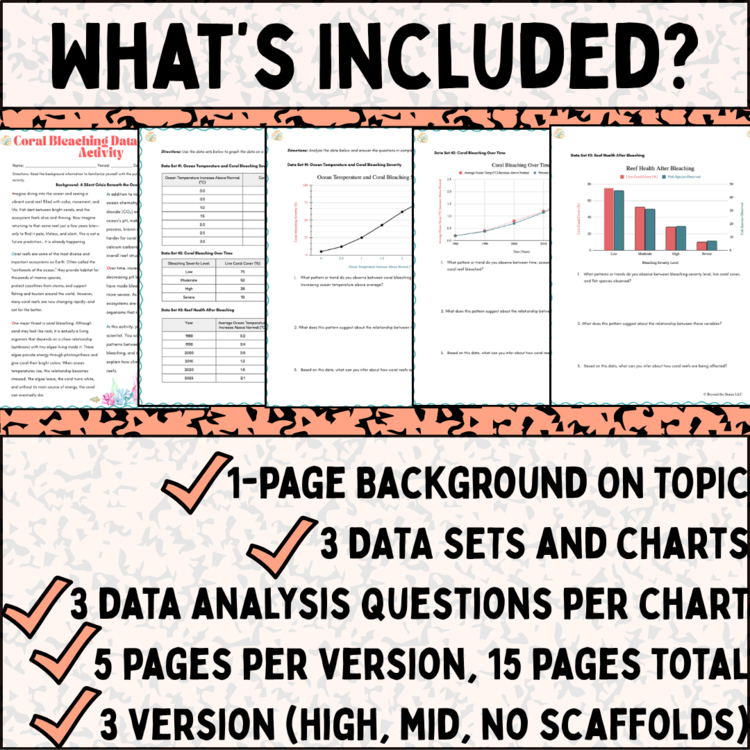
Per the current listing, students graph and interpret two connected data strands — sea-surface temperature anomalies and bleaching extent — to uncover patterns in real coral bleaching data. The exact component list (number of data sets and graphs, question sequence, answer key) is not enumerated in the current listing and should be confirmed before this section is expanded.
How it runs in class
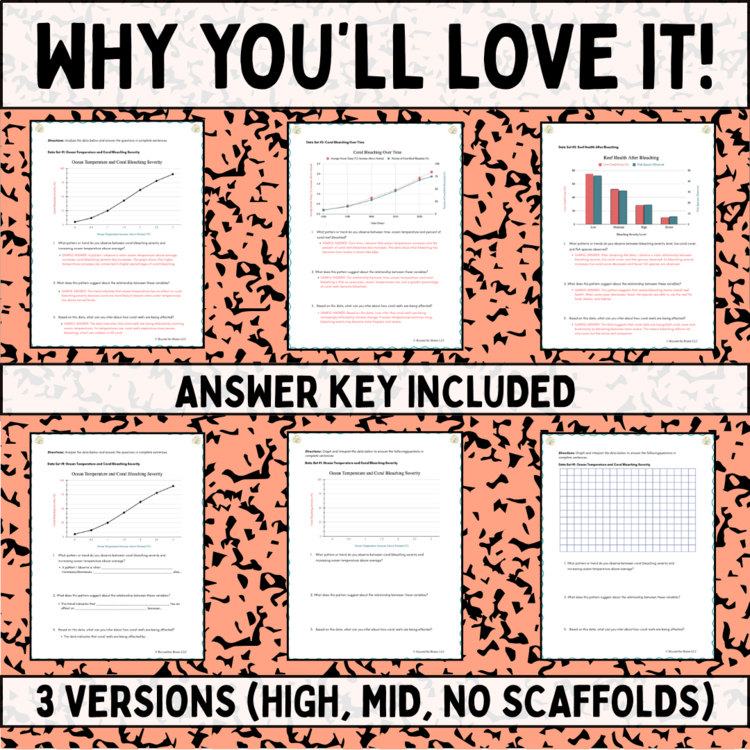
Run it as the quantitative core of a bleaching lesson: students construct the graphs, read the anomaly pattern against bleaching extent, and articulate the relationship in their own words. It works as the explore/elaborate engine inside the Coral Bleaching 5E Unit, as a standalone data-analysis day, or as the evidence base for a follow-up CER writing task — students argue far better about a pattern they graphed themselves. It also travels well: the same graphing-and-interpretation routine is the one used in the Arctic data analysis line, so skills transfer across units.
Standards alignment
NGSS: HS-LS2-2. Grades 8–12 · Biology, Chemistry, Environment.
The anomaly concept is worth a deliberate pause: students graph departures from a baseline, not raw temperatures, which is how climate scientists actually communicate change. A student who can explain why anomalies reveal the pattern better than absolute values has learned something transferable to every data set in this catalog — and the bleaching-extent overlay is where that skill meets its first real test.
Want the writing follow-through bundled in? This activity is paired with CER writing in the Coral Bleaching Data Analysis & CER Mini Bundle. Like the format? Try the same approach in the Arctic with the Polar Bears & Arctic Sea Ice data analysis activity. Free resources are in the Free Library.
Reviews
There are no reviews yet.